Every growth team knows the feeling. Revenue is tracking behind plan, the quarter is closing, and someone suggests a sale. The discount goes live, the dashboard turns green, and everyone exhales. Three weeks later, finance asks why contribution margin fell off a cliff, and nobody has a good answer.
Here is the uncomfortable part: this is not an occasional failure mode. It is the statistical norm. The most rigorous large-scale study of promotional effectiveness ever run, Nielsen’s analysis of more than one million UPCs and 39 million promotional events covering 555 billion dollars in US retail sales, found that 72 percent of US trade promotions fail to break even. Globally the figure is 59 percent. This is not a rounding error or a few bad campaigns. It is the majority outcome for an activity that consumer businesses fund with roughly 20 percent of gross revenue, typically their second-largest P&L line after cost of goods.
The consulting data tells the same story from a different angle. McKinsey’s retail analytics work puts 40 to 60 percent of promotions across sectors in the inefficient or unprofitable bucket, and attributes it to exactly what you would expect: unclear objectives, planning by intuition, and unmeasured second order effects like cannibalization and stock-up behavior. Nielsen went one step further and estimated that eliminating 22 percent of promotions outright would actually increase revenue. Operators know this at some level. In a Strategy& survey of leading consumer companies, 85 percent of executives said they were spending too much on promotional funding. They keep spending anyway, because the process that would tell them which promotions to kill does not exist inside their companies.
So the question is not whether promotions destroy margin. At most companies, measured honestly, they demonstrably do. The question is what separates the majority that lose money from the minority that compound. Nielsen’s data offers a clue: best in class promotions returned five times more than the least efficient ones. Same lever, radically different outcomes. The difference is not creativity. It is process.
Why the dashboard can be misleading
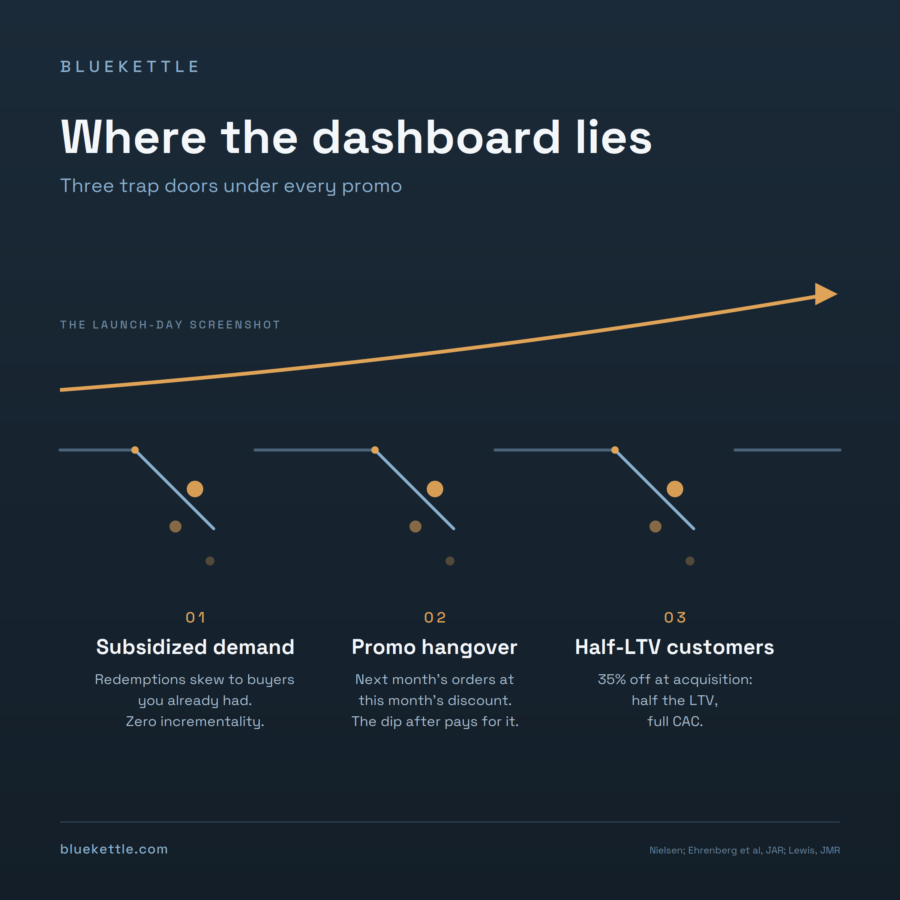
A promotion looks successful on the revenue line almost by definition. Discounts move units. The deception happens underneath, in three places.
The first is who actually bought. The classic study here is Ehrenberg, Hammond, and Goodhardt’s analysis of price promotions across 25 leading grocery brands in four countries, published in the Journal of Advertising Research. Their finding has held up for three decades: the short term sales spike came almost entirely from existing buyers of the brand, not new ones, and sales reverted to baseline the moment the promotion ended. No lift in subsequent sales, no lift in loyalty. The promotion did not recruit anyone. It handed a discount to people who were already yours.
The second is when they bought. A meaningful share of promotional volume is a pull forward, which creates a “hangover” effect by relocating sales from the next month into the period when you run the promotion; however, it’s one at a lower margin. It shows up as the post-promo dip every operator has seen and most dashboards politely ignore. Byron Sharp and the Ehrenberg-Bass tradition call this forward buying, and it means the honest read on any promotion requires watching the weeks after it ends, not just the spike during it.
The third cost is slower and nastier. The long run literature, most notably Mela, Gupta, and Lehmann’s work in the Journal of Marketing Research, shows that sustained promotional activity trains price sensitivity into your customer base and erodes brand equity over time. Every incremental sale event teaches the market that your list price is an opening offer. That is margin erosion that never appears on any single campaign’s readout, because it is distributed across every future transaction.
The acquisition side is not exempt
The usual defense of aggressive discounting is that it buys new customers, and new customers have lifetime value. The research says: it depends entirely on the depth, and the depth most teams use is destroying the asset they think they are building.
Michael Lewis’s study in the Journal of Marketing Research, using customer-level data from a newspaper and an online grocer, found that acquisition discount depth is negatively related to repeat purchase rates and customer asset value, and quantified it brutally: customers acquired with a 35 percent discount were worth roughly half the long term value of customers acquired without a promotion. You did not acquire a customer at a discount. You acquired half a customer at full media cost.
The pattern repeats in modern DTC data. Optimove’s analysis of first order discounts found the retention sweet spot sits between 5 and 20 percent, and, critically, that there was essentially no difference between a 10 percent and a 20 percent offer in either repeat purchase likelihood or future customer value. Which means every point of depth beyond the minimum effective discount is pure margin donation. Nielsen’s promotional data draws a similar ceiling from the other direction: discounts deeper than 25 percent off base price significantly degrade ROI, with returns diminishing as frequency climbs.
Net positive acquisition, defined
Put the evidence together and the standard a promotion must clear becomes concrete. Predicted lifetime value of the customers it acquires, adjusted for the LTV penalty that discount depth itself imposes, minus the discount cost, minus the media cost, minus the margin surrendered on cannibalized full price orders, must be greater than zero. Comfortably greater, because every input carries estimation error.
This reframes the goal of promotional strategy. You are not maximizing promo revenue. You are maximizing the volume of customers acquired at net positive economics. Sometimes that means a meaningful offer to a cold audience and no offer at all to your existing list. The blanket sitewide sale is usually the worst possible configuration on this measure, because Ehrenberg’s finding tells you exactly who redeems it: your least incremental buyer, the loyal customer who was checking out anyway, now at 25 points less margin.
Measuring incrementality without a data science team
None of this requires an experimentation platform. It requires deciding, before launch, that you will look. Hold out a random 10 percent of your audience from the promotion and compare purchase behavior through the promo window and the two weeks after, because pull forward reveals itself as the post window dip. Track new versus returning mix on promotional orders, since a promo where 80 percent of redemptions came from existing customers mostly subsidized purchases that needed no subsidy. And read results on a trailing four week basis, because a campaign that spikes week one and craters weeks two through four did not create demand. It relocated it.
Guardrails before calendar
Most promo planning starts with dates. It should start with constraints, agreed with finance before anything touches the calendar. A contribution margin floor per promotional order, set once, not renegotiated per campaign. Discount depth ceilings by segment, informed by the research: acquisition offers capped near the top of the effective range, retention offers shallow or replaced with non price mechanics entirely, and your best repeat customers almost never shown your steepest offer. Frequency limits, because Nielsen’s diminishing returns curve is really a description of customer training, and a sale every three weeks is not a promotional strategy, it is a lower price point with extra steps. And pre committed success criteria, in writing, so that a miss is information rather than something to be redefined into a win after the fact.
The process is the product
Notice what connects every failure mode above. It is not that anyone chose a stupid discount percentage. It is that the decision loop is slow, manual, and reactive. The promo launches, data trickles in, and by the time anyone has assembled the real economics, the next promo is live. McKinsey’s diagnosis of why 40 to 60 percent of promotions fail lands on the same point: intuition standing in for measurement, because measurement at calendar speed is beyond most teams’ capacity. Their prescription, notably, is the one we would give: analytics and agent-based systems that plan, monitor, and stress test promotional calendars continuously rather than quarterly.
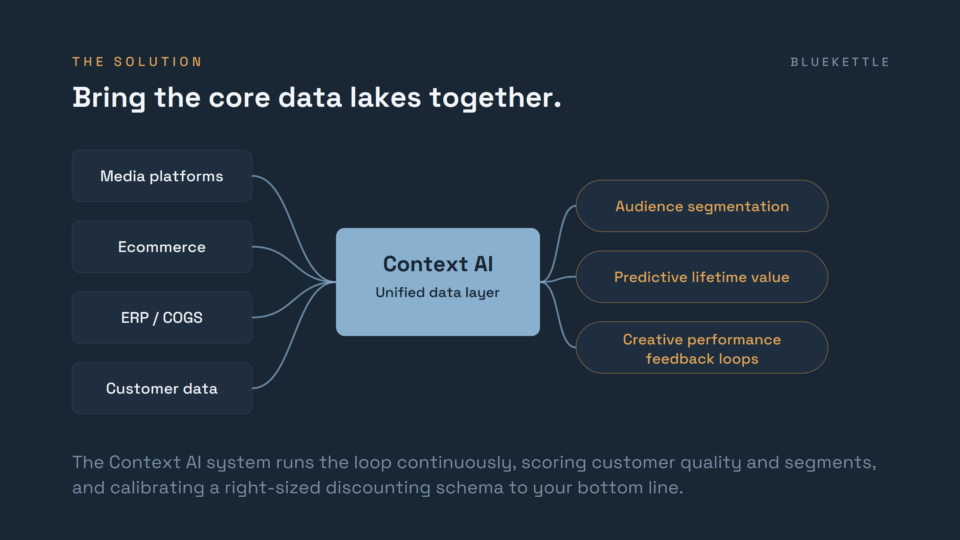
This is precisely where an agent-based operating model earns its keep. Segmentation agents identify which audiences respond incrementally to offers and which convert fine without them, so discount budget flows only where it changes behavior. Predictive lifetime value models turn the acquisition equation into a live threshold, the maximum you can spend in media plus discount to acquire each segment profitably, with the depth penalty priced in. And a continuous feedback loop on promotional performance means margin erosion gets flagged in days, not discovered in the monthly close.
The teams that land in Nielsen’s best-in-class cohort, earning five times the return of the worst, are not running cleverer offers. They are running a process that makes margin visible while there is still time to act on it.
The takeaway
The evidence is not ambiguous. Most promotions lose money, most discount depth beyond the minimum is wasted, and deep acquisition offers buy customers worth half as much. Held to a net positive acquisition standard, measured for incrementality, and governed by guardrails set before the calendar fills, promotions become what they should have been all along: a precision tool for buying growth at a price you chose on purpose.
The discount is not the strategy. The process is.
Sources referenced in the piece
Nielsen, Trade Promotion Performance (2016): 72 percent of US trade promotions fail to break even; 59 percent globally; eliminating 22 percent of promotions would increase revenue; best-in-class promotions return 5x the least efficient; deep discounts beyond 25 percent degrade ROI. McKinsey, How Analytics Can Drive Growth in CPG Trade Promotions (2019) and QuantumBlack retail promotions analysis (2026): CPGs invest roughly 20 percent of revenue in promotion; 40 to 60 percent of promotions across sectors are inefficient or unprofitable. Strategy& CPG trade spend survey: 85 percent of executives report overspending on trade funding. Ehrenberg, Hammond, and Goodhardt, The After-Effects of Price-Related Consumer Promotions, Journal of Advertising Research (1994). Mela, Gupta, and Lehmann, The Long-Term Impact of Promotion and Advertising on Consumer Brand Choice, Journal of Marketing Research (1997). Lewis, Customer Acquisition Promotions and Customer Asset Value, Journal of Marketing Research (2006). Optimove first order discount analysis via CMSWire (2020).